Ogab® Report – Environmental Impact of Disc Brakes Life Cycle
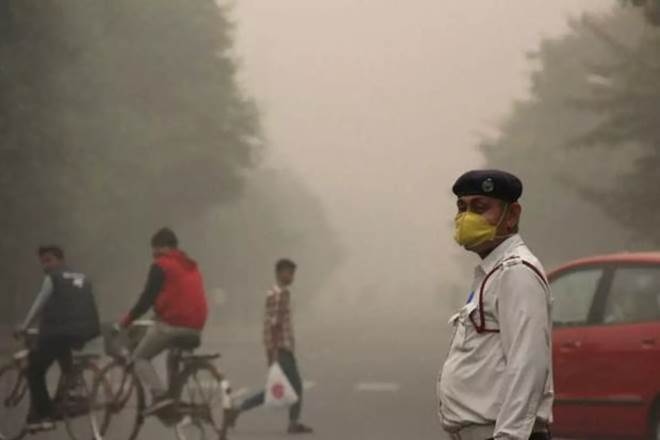
Air pollution kills 7 million people a year - and probably makes COVID-19 more deadly.
World Economic Forum – June 2020
1. Introduction
Human activities release a large number of different pollutants into the atmosphere, which harm human health and damage the environment. Disc brakes and pads are not an exception and their life cycle causes some environmental impacts, from raw materials obtention, product manufacturing and product use to end of life.
In this report, we analyse the environmental aspects of disc brakes and pads life cycle, used in road, rail and air transport. The environmental aspects that are significant are particulate matter, that contributes to air pollution, mineral resources scarcity, water pollution (freshwater eutrophication) and climate change (carbon footprint).
2. Particulate matter
Air pollution is one of the major concerns of urban areas, and brake wear emissions have a significant contribution to it as particulate matter.
Brake wear: Standard frictional brakes on a vehicle function by virtue of the friction between a brake pad and a rotating disc or drum when the two are forced together by application of pressure to the braking system. The frictional process causes abrasion both of the brake pad and of the surface of the disc or drum leading to the release of particles, a substantial fraction of which become airborne. (DEFRAa, 2019)
Particulate matter emissions consist of particles suspended in the air, for example: sea salt, black carbon from combustion, dust, and condensed particles from certain chemicals.
They are measured, according to the particle diameter size, as PM10 (diameter less than 10 micrometres), PM2.5 (less than 2.5 micrometres), and UFP (Ultra Fine Particles, less than 0.1 micrometres).
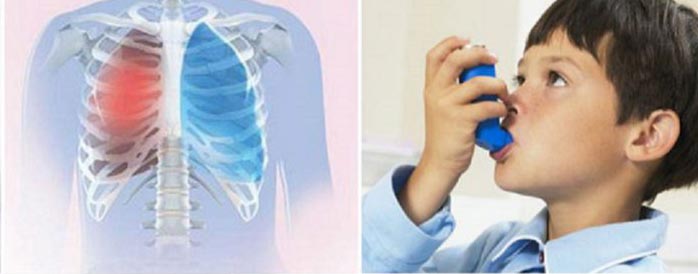
Many studies have demonstrated that particle size affects particle deposition in the respiratory tract, causing health problems. Coarse particles are mainly deposited in the upper respiratory tract (nose and throat), while ultrafine particles penetrate deep into the lungs, thus posing hazards related to oxidative stress and inflammation.
Particles emitted as a result of transport activity can be distinguished according to their source into:
- exhaust traffic-related particles, which are emitted as a result of incomplete fuel combustion and lubricant volatilization during the combustion procedure
- non-exhaust traffic-related particles, which are either generated from tyre, brake, clutch and road surface wear or already exist in the environment as deposited material and become resuspended due to traffic-induced turbulence, tyre shear and the action of the wind.
Hospital visit rates for known co-morbidities were calculated from NHS data in 2017 to 2018. These were split into cardiovascular and “other” co-morbidities to also examine known relationships of air pollutants on cardiovascular diseases. The conditions included were:
Alzheimer’s disease
Alzheimer’s disease is an irreversible, progressive brain disorder that slowly destroys memory and thinking skills and, eventually, the ability to carry out the simplest tasks. In most people with the disease—those with the late-onset type—symptoms first appear in their mid-60s.
Asthma
Asthma is a condition in which your airways narrow and swell and may produce extra mucus. This can make breathing difficult and trigger coughing, a whistling sound (wheezing) when you breathe out and shortness of breath.
Influenza and pneumonia
Influenza (flu) is a highly contagious viral infection that is one of the most severe illnesses of the winter season. Influenza is spread easily from person to person, usually when an infected person coughs or sneezes. Pneumonia is a serious infection or inflammation of the lungs.
Other acute respiratory infections
Acute respiratory infection is an infection that may interfere with normal breathing. It can affect just your upper respiratory system, which starts at your sinuses and ends at your vocal chords, or just your lower respiratory system, which starts at your vocal chords and ends at your lungs.
Bronchiectasis
Bronchiectasis is a disease in which there is permanent enlargement of parts of the airways of the lung. Symptoms typically include a chronic cough with mucus production. Other symptoms include shortness of breath, coughing up blood, and chest pain.
Cancer
Cancer is a condition where cells in a specific part of the body grow and reproduce uncontrollably. The cancerous cells can invade and destroy surrounding healthy tissue, including organs. Cancer sometimes begins in one part of the body before spreading to other areas. This process is known as metastasis. Cancer is the second leading cause of death globally, accounting for an estimated 9.6 million deaths, or one in six deaths, in 2018.
Cardiovascular conditions (all: current or recent) — ischaemic heart disease, angina, myocardial infarction; heart failure; stroke; and Atrial fibrillation
Cardiovascular disease (CVD) is a general term for conditions affecting the heart or blood vessels. It’s usually associated with a build-up of fatty deposits inside the arteries (atherosclerosis) and an increased risk of blood clots.
Chronic kidney disease including renal failure
The term “chronic kidney disease” means lasting damage to the kidneys that can get worse over time. If the damage is very bad, your kidneys may stop working. This is called kidney failure, or end-stage renal disease (ESRD). If your kidneys fail, you will need dialysis or a kidney transplant in order to live.
Chronic liver disease including liver failure
When you have cirrhosis, scar tissue slows the flow of blood through the liver. Over time, the liver can’t work the way it should. In severe cases, the liver gets so badly damaged that it stops working. This is called liver failure.
Chronic obstructive pulmonary disease including respiratory failure
Chronic obstructive pulmonary disease (COPD) is a chronic inflammatory lung disease that causes obstructed airflow from the lungs. Symptoms include breathing difficulty, cough, mucus (sputum) production and wheezing.
Dementia
Dementia is a syndrome in which there is deterioration in memory, thinking, behaviour and the ability to perform everyday activities. Although dementia mainly affects older people, it is not a normal part of ageing. Worldwide, around 50 million people have dementia, and there are nearly 10 million new cases every year.
Diabetes
Diabetes is a disease that occurs when your blood glucose, also called blood sugar, is too high. Blood glucose is your main source of energy and comes from the food you eat. Insulin, a hormone made by the pancreas, helps glucose from food get into your cells to be used for energy. Sometimes your body doesn’t make enough—or any—insulin or doesn’t use insulin well.
Epilepsy
Epilepsy is a central nervous system (neurological) disorder in which brain activity becomes abnormal, causing seizures or periods of unusual behaviour, sensations, and sometimes loss of awareness. Anyone can develop epilepsy. Epilepsy affects both males and females of all races, ethnic backgrounds and ages.
Hypertension
Hypertension – or elevated blood pressure – is a serious medical condition that significantly increases the risks of heart, brain, kidney and other diseases.
Inflammatory bowel disease
Irritable bowel syndrome (IBS) is a common disorder that affects the large intestine. Signs and symptoms include cramping, abdominal pain, bloating, gas, and diarrhoea or constipation, or both.
Neurological conditions – motor neurone disease, Parkinson’s disease and multiple sclerosis
Neurological conditions are disorders of the brain, spinal cord or nerves. They can have a range of causes including genetic factors, traumatic injury and infection. The causes of some of these conditions are still not well understood.
Osteoarthritis
Osteoarthritis is the most common form of arthritis, affecting millions of people worldwide. It occurs when the protective cartilage that cushions the ends of your bones wears down over time. Although osteoarthritis can damage any joint, the disorder most commonly affects joints in your hands, knees, hips and spine.
Osteoporosis
Osteoporosis is a health condition that weakens bones, making them fragile and more likely to break. It develops slowly over several years and is often only diagnosed when a fall or sudden impact causes a bone to break (fracture).
Rheumatoid arthritis
Rheumatoid arthritis is a long-term condition that causes pain, swelling and stiffness in the joints. The condition usually affects the hands, feet and wrists. There may be periods where symptoms become worse, known as flare-ups or flares.
Serious mental illness
Serious mental illness (SMI) is defined as a mental, behavioural, or emotional disorder resulting in serious functional impairment, which substantially interferes with or limits one or more major life activities. The burden of mental illnesses is particularly concentrated among those who experience disability due to SMI.
To align co-morbidities with the deaths data, these were adjusted for age in the same manner as the deaths data to create a hospital visit rate per 100,000 people. We intended not to reweight them by the age functions related to the specific diseases, but simply to put them back into alignment with the death data. There was a very clear relationship between the unadjusted death and comorbidity data, which was lost when examining the age adjusted deaths data.
2.1 Brake particulate matter emission in road transport
Brake emissions are the most significant non-exhaust emissions of road vehicles, particularly within areas with high traffic density and braking frequency. In fact, approximately 50% of PM emissions from a car are non-exhaust particles, and of the non exhaust PM, about 50% originate from the disc brakes.
In urban environments, brake wear can contribute up to 55% by mass to total non-exhaust traffic-related PM10 emissions and up to 21% by mass to total traffic related PM10 emissions, while in freeways and rural areas this contribution is lower due to lower braking frequency.
Table 1 Emission factors for PM10 from tyre and brake wear and road abrasion. Source: DEFRAa, 2019
| Vehicle | Type of road | Emission factors for PM10 (mg PM10/km) | ||
|---|---|---|---|---|
| Tyre ware | Brake ware | Road abrasion | ||
| Car | Urban | 8.7 | 11.7 | 7.5 |
| Rural | 6.8 | 5.5 | ||
| Motorway | 5.8 | 1.4 | ||
| LGV | Urban | 13.8 | 18.2 | 7.5 |
| Rural | 10.7 | 8.6 | ||
| Motorway | 9.2 | 2.1 | ||
| Rigid GHV | Urban | 20.7 | 51.0 | 38.0 |
| Rural | 17.4 | 27.1 | ||
| Motorway | 14.0 | 8.4 | ||
| Artic HGV | Urban | 47.1 | 51.0 | 38.0 |
| Rural | 38.2 | 27.1 | ||
| Motorway | 31.5 | 8.4 | ||
| Bus | Urban | 21.2 | 53.6 | 38.0 |
| Rural | 17.4 | 27.1 | ||
| Motorway | 14.9 | 8.4 | ||
| Motorcycles | Urban | 3.7 | 5.8 | 3.0 |
| Rural | 2.9 | 2.8 | ||
| Motorway | 2.5 | 0.7 | ||
An average vehicle in a Swedish urban area emits 60 mg PM10 per km, considering both exhaust and non-exhaust emissions (Ferm and Sjöberg, 2015). So the non-exhaust particles emitted from tyre and brake wear and road abrasion have a significant contribution to the PM10 emissions of a vehicle.
98% (by mass) of airborne brake wear particles can be classified as PM10, whilst around 40% of the PM10 is PM2.5, 10% is PM1, and 8% is PM0.1.
It is estimated that only 7% of PM2.5 pollution from traffic comes from tail pipe exhaust fumes at roadside sites. The rest comes from sources such as tyre, clutch and brake wear, as well as the resuspension of road dust. Brake dust is the source of 21% of total PM2.5 traffic pollution. These are particles small enough to be inhaled into the deepest regions of the lung.
Dust from brake friction is rich in metals, which can catalyse the production of reactive oxygen species, chemicals which can cause damage to cells on entering the lungs. Metal particles of this size from the abrasion of brake pads may cause inflammation and reduce the ability of immune cells to kill bacteria, similar to particles derived from diesel exhaust. This is why the chemical characterization of brake wear dust is important when considering its impact.
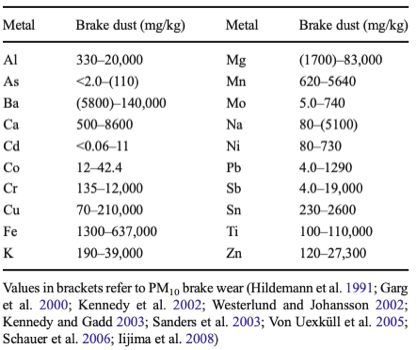
The dust composition will depend on the manufacturer, the application (car, train, etc.) and pad properties, but studies show that the most important chemical constituents of brake wear are Fe (iron) with a contribution up to 46%, Cu (copper) with a content of up to 14%, organic material in the order of 13%, and then several other metals, including Pb (lead) (~4%), Zn (zinc) (~2%), Ca (calcium) and Ba (barium).
In the next table, it shows the concentration ranges of elements found in brake wear dust based on the literature review by Grigoratos and Martini (2014). It can be seen that the concentration of each element can significantly vary, but in any case, the most important element is iron.
Table 2 Trace element concentrations found in emitted brake wear dust. Source: Grigoratos and Martini, 2014
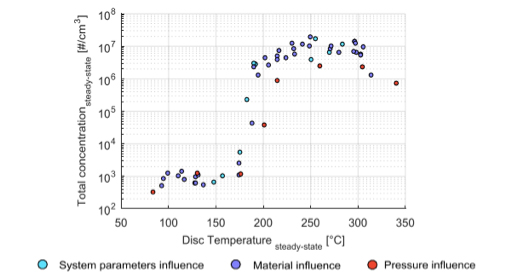
The wear will typically produce relatively coarse airborne particles, but the temperature can cause some variations, as it is shown in Figure 1. Higher temperatures associated with brake components will typically promote the generation of ultrafine particles and increase particle concentration. In fact, the emission will increase of several magnitude orders in the range 170-200°C. An additional consequence of the temperature increase is a progressive shift in the number size distribution towards the ultrafine fraction.
Figure 1 Transition temperature of disc for different testing conditions and concentration of particles. Source: Alemani, 2017.
The emission of particulate matter can be translate to reduction in life expectancy, due to health effects, such as cardiovascular and respiratory diseases and cancer. Alemanti (2017) estimated Years of Life Lost (YLL), an indicator to evaluate the reduction in life expectancy, due to PM emissions.
Figure 2 Years of Life Lost (YLL) in European urban areas due to different PM sources. Source: Alemani, 2017.
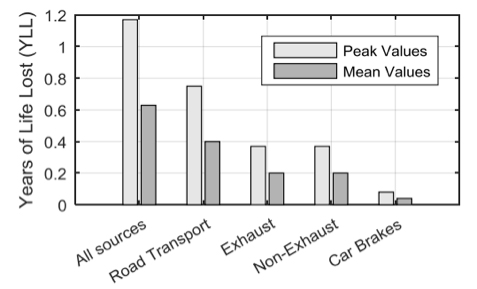
According to Alemani, the mean life expectancy in European urban areas is reduced by 0.63 years per person, with peaks of 1.2 YLL. Brake particulate matter in Europe is responsible for 0.043 YLL per person on average (i.e. 16 days of life lost), with peak values up to 0.08 (i.e. 27 days of life lost), as shown by Figure 2.
2.2 Brake particulate matter emission in rail transport
In rail transport, non-exhaust particle emissions are produced by the abrasion of brakes, wheels and rails.
Gehrig et al. (2007) made measurements at various distances from an electrified rail line in Switzerland. At around 10m from the trackside, PM10 concentrations were found to be around 1 μg/m3 above that measured at a nearby background site. This was dominated by Fe with smaller contributions from Cu, Mn (manganese) and Cr (chromium). The Fe particles were predominately (72%) in the coarse particle size. Particle concentrations reduced with distance from the railway line. In fact, PM10 concentrations at 120m from the railway were only 25% of that measured at 10m.
The German railway company Deutsche Bahn AG estimates the following emission factors from the contact line, braking and from the wheel/track interface:
Table 3 Non-exhaust emission factors for PM10 and PM2.5 from railways in Germany and France. PM2.5 in Germany is estimated as a fraction of 50% of PM10. Source: DEFRAa, 2019
| Non-exhaust emission sources | Emission factor (mg/km) | ||
|---|---|---|---|
| PM10 | PM2.5 | ||
| Germany | Wear of braking system | 6.0 | 3.0 |
| Wear of contact line | 0.3 | 0.1 | |
| Wear of wheel/track interface | 18 | 9 | |
| France | Wear of braking system | 5.0 | 2.3 |
| Wear of contact line | 0.16 | 0.02 | |
| Wear of wheel/track interface | 3.4 | 1.0 | |
An existing brake pad and disc combination gives a service life for the steel axle-mounted disc of between 800,000 and 1.1 million km, while an improvement friction material, the disc life can be improved to an estimated 2.57 million km, which means less wear and impacts from replacement.
2.3 Brake particulate matter emission in air transport
Aircraft engines are just one of the many sources of pollution in the area of airports, but other sources are particularly dangerous at local scale. Among them, the products of wear of tyres, brakes and runways. In addition, the strong air turbulence generated by aircraft leads to the resuspension of these pollutants in the air.
An aircraft approach causes a significant effect on the quality of air in the area adjacent to the airport. According to the study developed by Jasiński et al (2016), at a distance of about 2 km from the aircraft touchdown point, the main symptom is a change in the concentration of particulate matter of diameter less than 100nm (PM0.1 or UFP), particulates that are most harmful to human health. A single landing operation causes an increase of the value of particle number concentration tens of times, and it is maintained for a period of at least 60 seconds.
3. Product life cycle environmental impacts
Brake discs and pads not only have an impact due to wear, but also during the product life cycle, they generate significant environmental impacts.
The environmental impacts analysed are mineral resources scarcity, water pollution (freshwater eutrophication) and climate change (carbon footprint), although the results are presented for more impact categories.
Mineral resources scarcity: Assessment of consumption of natural resources, including their scarcity and the speed of their exploitation. The more the resource is considered as scarce and exploited, the more the value of the indicator increases and the more the product contributes to the depletion of resources.
Mineral resources scarcity impact category is expressed in kg of copper equivalent (kg Cu eq).
Freshwater eutrophication: Freshwater eutrophication can be defined as nutrient enrichment of the aquatic environment. Eutrophication in inland waters as a result of human activities is one of the major factors that determine its ecological quality. On the European continent it generally ranks higher in severity of water pollution than the emission of toxic substances. So this category assesses substances (especially phosphates and nitrates) contributing to the proliferation of algae and aquatic species in the water. The respiration of these organisms, then their decomposition, causes a decrease in the dissolved oxygen content of the aquatic environment, disturbing the balance of the ecosystem, reducing animal and plant diversity, even causing it to disappear.
Freshwater eutrophication is expressed in kg of phosphorous equivalent (kg P eq).
Climate change: Assessment of greenhouse gas emissions contributing to the greenhouse effect. The greenhouse effect causes changes in the Earth’s climate, including an increase in average temperature.
Climate change category is expressed in kg of carbon dioxide equivalent (kg CO2 eq).
It has to be considered that in Europe there are in average 238 million cars, which means there exist 952 million disc brakes and 1,904 million pads.
During the lifetime of a car, i.e. 240,000 km, pads and discs will be replaced. The life length of the different parts depends on wear resistance. So, during the lifetime of the car 14 pads will be required and 2.5 discs per disc bake.
Table 4 Disc brake parts required per brake during the car lifetime and spare parts as replacement. Source: Gradin and Åström, 2020
| Disc brake part | Lifetime units required | Lifetime spare parts required |
|---|---|---|
| Pads | 14 | 12 |
| Discs | 2.5 | 1.5 |
Considering the full life cycle of a passenger car disc brake during the car lifetime, the environmental impact for the three categories is:
Table 5 Environmental results of a reference disc brake used during a car lifetime (240,000 km). Source: Gradin and Åström, 2020
| Environmental impact category | Unit | Value per disc brake during the car lifetime |
|---|---|---|
| Mineral resources scarcity | kg Cu eq | 1.53 |
| Freshwater eutrophication | kg P eq | 0.1 |
| Climate change | kg CO2 eq | 90 |
| Stratospheric ozone depletion | Kg CFC11 eq | 0.000069 |
| Ionizing radiation | kBq Co-60 eq | 19.0 |
| Ozone formation, human health | kg NOx eq | 0.2 |
| Fine particulate matter formation | kg PM2.5 eq | 0.9 |
| Ozone formation, terrestrial ecosystems | kg NOx eq | 0.2 |
| Terrestrial acidification | kg SO2 eq | 0.6 |
| Terrestrial ecotoxicity | kg 1.4-DBC e | 41.8 |
| Freshwater ecotoxicity | kg 1.4-DBC e | 14.9 |
| Marine ecotoxicity | kg 1.4-DBC e | 88.9 |
| Human carcinogenic toxicity | kg 1.4-DBC e | 46.0 |
| Human non-carcinogenic toxicity | kg 1.4-DBC e | 36,532 |
| Land use | m2a crop eq | 2.84 |
| Fossil resource scarcity | kg oil eq | 47.85 |
| Water consumption | m3 | 214.86 |
The brake considered in the study developed by Gradin and Åström (2020) weights 7.058 kg, 6.6 kg the disc and 0.229 kg each pad. The total amount of material consumed per 240,000 km is 19.7 kg, which, according to the results, is equivalent to consuming 1.53 kg of virgin copper (Cu). It has to be considered that the studied brake is composed mainly of recycled material, with a low contribution to mineral resources scarcity.
The greenhouse gas emissions related to the braking system during the lifetime of a car, 90 kg CO2 eq, equals to the emissions generated during a trip of 508 km in an average passenger car (DEFRAb, 2020).
The Fossil resource scarcity, related to fossil fuels consumption during the product life cycle, is 47.85 kg oil eq. This could be translated to non-renewable energy demand of 2,195 MJ (2.18E-2 kg oil eq/MJ conversion factor).
The primary contributing impacts of reference disc brake materials and processes are linked to the cast iron, the manufacturing of the discs, manufacture of pads and materials in the pads friction mix, such as copper and brass. It has to be considered that the impact of the additional reference disc spare part has a notable impact due to manufacturing and use of cast iron.
Some other impact categories were analysed by Gradin and Åström (2020), including ‘Fine PM formation’, ‘terrestrial ecotoxicity’, ‘marine ecotoxicity’ and ‘human noncarcinogenic toxicity’. For all this four categories, the life cycle impact was primarily linked to the brake wear emissions.
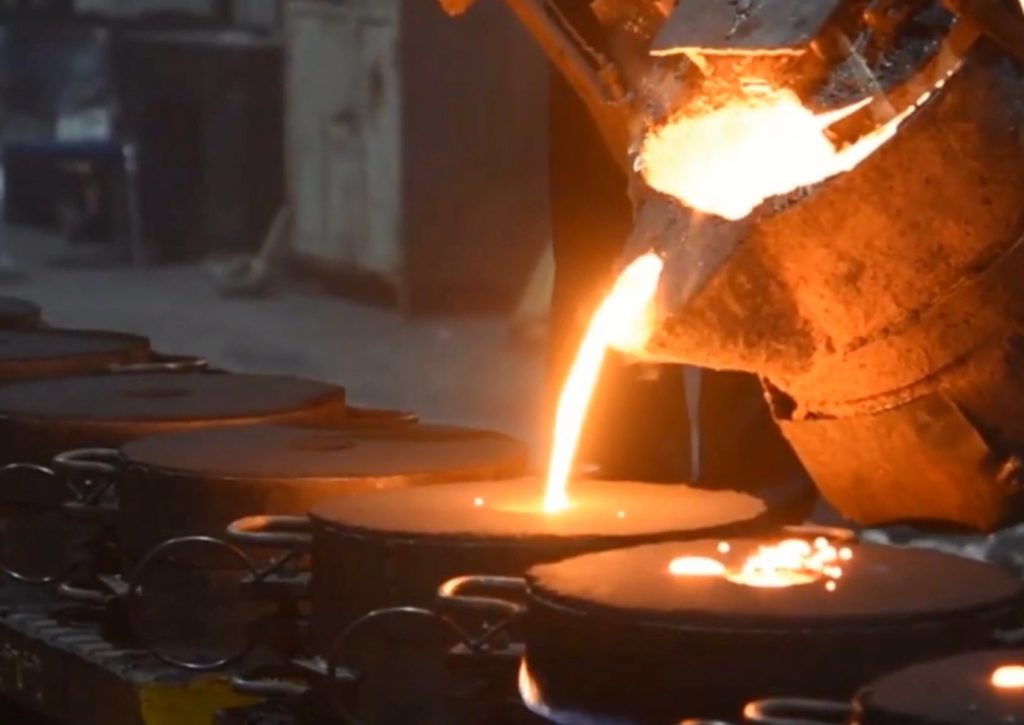
As the manufacturing stage is the most significant stage for impact categories related to climate change, water quality and material scarcity, the impact of this stage is analysed per one brake disc. A car brake disc was studied by Andersson and Dettmann (2013), a product made of cast iron with 35% scrap and 65% pig iron, considering 9 variants of the product. The weight of each product variant (finished product), raw material consumed and removal material during the product manufacturing (chips) is presented in the next table:
Table 6 Weight of each variant, expressed in kilograms. Source: Andersson and Dettmann, 2013
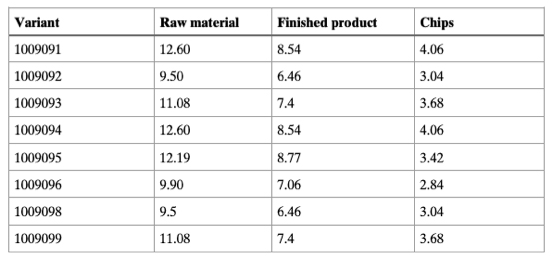
The environmental impact calculations resulted in an impact of between 14.4 and 19.9 kg CO2 eq per brake disc, depending on the variant. Apart from climate change impact category, acidification and eutrophication impact categories were evaluated.
Table 7 Climate change (GWP), Acidification (AP) and Eutrophication (EP) results per brake disc. Source: Andersson and Dettmann, 2013
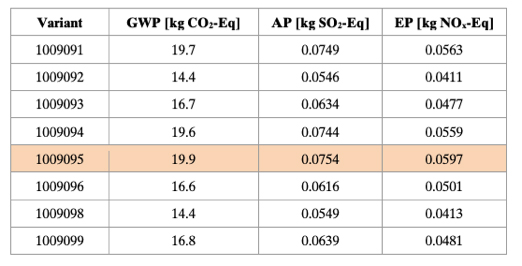
The analysis showed that production of raw material (including both material for finished products and for removed material, i.e. chips) accounts for the major share of environmental impact. The main difference in impact can be attributed to different weights of the variants.
Figure 3 Carbon footprint of each disc brake variant and the contribution of raw material (used in the finished product or waste generated during the manufacturing process – chips -, transport of raw material (used in the finished product or in the chips obtained as waste) and other processes. Source: Andersson and Dettmann, 2013.
So, to produce 200 disc brakes, assuming that an average disc weights 7 kg, 1,400 kg of steel would be consumed. This means that 3,465 kg CO2eq would be emitted to produce them and 11,819 kWh of primary energy (electricity but also fuels, such as natural gas) would be consumed.
If instead of a 7 kg disc brake, we consider a 8.77 kg disc brake, the heaviest variant studied by Andersson and Dettmann (2013), which has a carbon footprint of 19.9 kg CO2 eq, 200 discs would have a primary energy consumption of 14,808 kWh.
The carbon footprint of one 8.77 kg brake disc production would be equivalent to 69.8 miles when driving an average car, considering an emission factor of 0.28502 kg CO2 eq per mile (DEFRA, 2019b).
4. Global values
It has to be considered that in Europe there are in average 238 million passenger cars, which means there are 952 million disc brakes and 1,904 million pads.
Each passenger car contains 4 brake discs and 8 pads, which weights ca. 30 kg in global. During the life span of a car, 240,000 km, 10 discs will be required and 56 pads, which means that during the car life span almost 83 kg of cast iron will be consumed to perform the brake requirements. Worldwide there were in 2015 947 million cars, which means that during their life span they will consume 78 million tons of brake material, mainly cast iron. The energy required to produce them is 662 million MWh and they will emit 194 million tons of CO2 eq, contributing to the climate change.
Worldwide 335 million commercial vehicles, such as lorries and vans, are circulating (year 2015). The brake block will need to be replaced every 1.67 years, which means that every year 120 kg of steel will be needed per vehicle on average. Every year, for the world’s fleet, 40 millions of tons of steel will be consumed, with its correspondent energy demand, 390 million MWh, and greenhouse gas emissions, 119 million tons of CO2 eq.
In Europe, there are over 585,000 railway wagons in use that contain brake shoes. Due to abrasion of brake, annually, a wagon will require 9 new brake shoes, which means 90 kg of cast iron consumed. For the wagon life span of 40 years, 3,600 kg of cast iron per wagon will be needed. If we extend this amount to all wagons in Europe, every year 5 million brake shoes are replaced, which means 52,722 tons of cast iron consumed. In terms of energy required to manufacture these new products, annually 445,095 MWh of energy will be consumed, which will have a carbon footprint of 130,488 t CO2 eq.
In 2018, the world’s aircraft fleet was of 25,830, each aircraft containing on average 800 kg of braking sets.
An average aircraft wheel brake weights ca. 100 kg of steel or carbon fibre. If 8 brake sets are needed per aircraft, the braking system of an average passenger or freight aircraft weights 800 kg. This means that worldwide ca. 21,000 tones of aircraft brake are being used.
The average brake life span is 2,000 landings, which means that at the current number of flights globally performed, every 1.3 years these 21,000 tons will need to be replaced.
So, every year 16,154 tons of material will be consumed to replace brake sets, which will have an energy demand during the manufacturing stage of between 126,868 MWh and 4,8 million MWh, depending on the brake material. The carbon footprint will be between 37,138 t CO2 eq and 878,673 kg CO2.
Table 8 Disc brake energy demand, carbon footprint and energy demand during the product manufacturing
| Mean of transport | Geographical scope | Temporal scope | Material consumption (tons) | Carbon footprint (tons CO2 eq) | Energy demand (MWh) |
|---|---|---|---|---|---|
| Cars | Worldwide: 947 million cars | Cars life span (240,000 km) | 78,440,954 | 194,141,361 | 662,218,099 |
| Commercial vehicles | Worldwide: 335 million lorries and vans | Yearly | 40,433,432 | 119,172,780 | 390,421,843 |
| Rail wagons | Europe: 585,000 wagons | Yearly | 52,722 | 130,488 | 445,096 |
| Aircrafts | Worldwide: 25,830 aircrafts | Yearly | 16,154 | 37,138 (steel brake) – 878,673 (carbon brake) | 126,868 (steel brake) – 4,837,598 (carbon brake) |
5. Railway tracks buckling

A critical part of the railway infrastructure is the track; track failures potentially affect safety and may cause delays in the speed.
According to the Texas Federal Railroad Administration, there have been 5,977 rail accidents within the United States in the period 2012-2014. Of these, approximately 1% (58) are listed as being caused by rail buckling.
In UK, according to Network Rail alteration database, the long term average detected railway buckles are 30-40 per annum. In 2003, when a heatwave was experienced, 137 railway buckles were detected.
According to the simulation by Nguyen et al (2012), in Melbourne, Australia, under an extreme heatwave similar to the event of January 2009, the buckling failure probability of railway is about 2/100,000 on average.
Track buckling is the formation of large lateral misalignments in continuous welded rail (CWR) track. Lateral thermal buckling is a common cause of derailments in CWR tracks. Since CWR tracks are constrained against the motion along the direction of travel, extreme temperature changes can induce compressive stresses in the rails that can lead to track buckling. Because rails are made from steel, they expand as they get hotter, and can start to curve. Most of the network can operate when track temperatures heat up to 46°C–roughly equivalent to air temperature of around 30°C, but also train brake can have a contribution to track heating.
Almost all the research is related to environmental temperature, with special attention to the effects on the rail buckling due to climate change. Even though compressive forces that cause buckling result from stresses induced in a constrained rail by temperature above its “stress free” state, but also from mechanical sources such as braking, rolling friction and wheel flanging on curves. In fact, when a train is going up and down multiple hills, too much compressed force can be created and the probability of buckling can increase. So, places with more braking intensity are subject to more probability of buckling events.
In UK, 175 metres of rail will be replaced every year due to buckling, considering an average 35 buckle events per year and assuming a renewal rail of 5 metres.
An average rail weights 60 kg/m, so 10,500 kg of steel will be consumed annually in UK because of buckling. This means 17 tons of CO2 eq annual and primary energy demand of 212,307 MJ (58,974 kWh).
In UK there are 31,000 km of tracks while in Europe there are ca. 340,000 km of rail tracks, so results are also calculated for Europe.
Table 9 Annual buckle events energy demand and carbon footprint in Europe and UK.
| Geographical scope | Material consumption (tons) | Carbon footprint (kg CO2 eq) | Energy demand (kWh) |
|---|---|---|---|
| UK | 10.5 | 17,264 | 58,974 |
| Europe | 115 | 189,343 | 646,814 |
6. Air transport fuel consumption
Fuel conservation is a significant concern of every airline. During landing and take-off cycle phase (LTO), up to 950m, the specific fuel consumption is significantly higher than it is for cruising. As shown in the next table, the share of LTO of the total trip length is higher for a short/medium flight than it is for a long haul flight.
Table 10 Share of fuel consumption of LTO. Source: Spielmann, 2007
| Distance (km) | LTO (kg fuel/LTO) | Cruise (kg fuel/km) | Cruise total (kg fuel) | LTO (% fuel consumption) | Cruise (% fuel consumption) | |
|---|---|---|---|---|---|---|
| Intra Europe | 500 | 730 | 2 | 1,050 | 41.01 | 58.99 |
| Intercontinental Long Haul | 6,000 | 3,100 | 11 | 66,000 | 4.49 | 95.51 |
| Average Freight Transport (5.4% EU, 94.6% INT) | 5,725 | 2,982 | 10.55 | 60,399 | 4.70 | 95.30 |
| Average Passenger Transport (29.9% EU, 70.1% INT) | 4,157 | 2,389 | 8.3 | 34,507 | 6.47 | 93.53 |
During the landing, a pitch manoeuvre during the flare portion of the approach increases drag and decelerates the aircraft to minimum flying speed. The deceleration on the landing roll will be accomplished by braking and reverse thrust. During take-off, the acceleration of the aircraft along the runway will depend on the following forces: Thrust of propulsion system pushing aircraft along runway, aerodynamic drag of vehicle resisting the aircraft motion and rolling resistance friction due to the contact of wheels or skids on the ground.
So, in this section, the LTO cycle is analysed. The standard values of thrust setting and time are taken from the standard values defined by ICAO.
Figure 4 Illustration of ICAO standard values of thrust settings and times in mode of LTO cycle to certify engine fuel burn and emissions. Source: ICAO, 2019
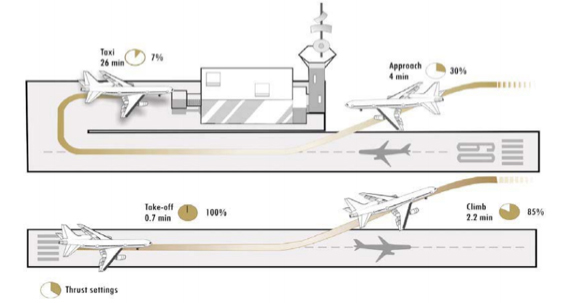
The average fuel consumption on each LTO cycle action of more than 600 engines from 15 worldwide manufacturers has been obtained and used to determine the environmental impact of LTO cycle. The widely used fuel is Jet A, a type of kerosene.
Table 11 Average fuel consumption during LTO cycle actions. Source: ICAO, 2019
| Fuel consumption | Landing – Take off cycle actions | LTO cycle | |||
|---|---|---|---|---|---|
| Take off | Climb | Approach | Taxi (idle) | ||
| kg/second | 1.68 | 1.37 | 0.46 | 0.16 | – |
| kg/engine | 71 | 181 | 111 | 249 | 612 |
| kg/aircraft and cycle (considering 2 engines per aircraft) | 142 | 363 | 223 | 498 | 1,225 |
| tons per year (considering 40,300,000 movements worldwide) | 5,703,362 | 14,611,260 | 8,978,843 | 20,062,160 | 49,355,624 |
The related impacts for yearly air transport activity are presented below, evaluating environmental and health impacts.
Table 12 Environmental impacts related to one LTO cycle per aircraft
| Environmental impact category | Units per aircraft and LTO | Take off | Climb | Approach | Taxi (idle) | LTO cycle |
|---|---|---|---|---|---|---|
| Climate change | kg CO2 eq | 522 | 1,338 | 822 | 1,837 | 4,520 |
| Stratospheric ozone depletion | Kg CFC11 eq | 1.74E-04 | 4.45E-04 | 2.74E-04 | 6.12E-04 | 1.50E-03 |
| Ionizing radiation | kBq Co-60 eq | 3.94 | 10.09 | 6.20 | 13.86 | 34.09 |
| Ozone formation, human health | kg NOx eq | 2.28 | 5.83 | 3.58 | 8.00 | 19.69 |
| Fine particulate matter formation | kg PM2.5 eq | 0.48 | 1.23 | 0.76 | 1.69 | 4.17 |
| Ozone formation, terrestrial ecosystems | kg NOx eq | 2.31 | 5.91 | 3.63 | 8.11 | 19.96 |
| Terrestrial acidification | kg SO2 eq | 1.50 | 3.85 | 2.36 | 5.28 | 12.99 |
| Freshwater eutrophication | kg P eq | 1.26E-03 | 3.22E-03 | 1.98E-03 | 4.42E-03 | 1.09E-02 |
| Terrestrial ecotoxicity | kg 1.4-DBC e | 420 | 1,076 | 661 | 1,478 | 3,636 |
| Freshwater ecotoxicity | kg 1.4-DBC e | 0.17 | 0.43 | 0.26 | 0.59 | 1.45 |
| Marine ecotoxicity | kg 1.4-DBC e | 0.65 | 1.67 | 1.03 | 2.29 | 5.64 |
| Human carcinogenic toxicity | kg 1.4-DBC e | 1.69 | 4.33 | 2.66 | 5.95 | 14.63 |
| Human non-carcinogenic toxicity | kg 1.4-DBC e | 10 | 26 | 16 | 36 | 89 |
| Land use | m2a crop eq | 0.86 | 2.19 | 1.35 | 3.01 | 7.41 |
| Mineral resources scarcity | kg Cu eq | 0.13 | 0.34 | 0.21 | 0.46 | 1.14 |
| Fossil resource scarcity | kg oil eq | 174 | 446 | 274 | 613 | 1,508 |
| Water consumption | m3 | 0.86 | 2.20 | 1.35 | 3.02 | 7.42 |
| Cumulative energy demand | MJ | 7,593 | 19,452 | 11,954 | 26,709 | 65,709 |
Table 13 Environmental impacts related to annual air movements worldwide
| Environmental impact category | Units per annual air movements worldwide | Take off | Climb | Approach | Taxi (idle) | LTO cycle |
|---|---|---|---|---|---|---|
| Climate change | kg CO2 eq | 21,050,212 | 53,927,861 | 33,139,497 | 74,046,277 | 182,163,846 |
| Stratospheric ozone depletion | Kg CFC11 eq | 7 | 18 | 11 | 25 | 61 |
| Ionizing radiation | kBq Co-60 eq | 158,742 | 406,675 | 249,908 | 558,391 | 1,373,716 |
| Ozone formation, human health | kg NOx eq | 91,698 | 234,917 | 144,360 | 322,556 | 793,530 |
| Fine particulate matter formation | kg PM2.5 eq | 19,416 | 49,741 | 30,567 | 68,297 | 168,021 |
| Ozone formation, terrestrial ecosystems | kg NOx eq | 92,945 | 238,114 | 146,324 | 326,945 | 804,328 |
| Terrestrial acidification | kg SO2 eq | 60,494 | 154,977 | 95,236 | 212,793 | 523,499 |
| Freshwater eutrophication | kg P eq | 51 | 130 | 80 | 178 | 438 |
| Terrestrial ecotoxicity | kg 1.4-DBC e | 16,932,397 | 43,378,562 | 26,656,791 | 59,561,439 | 146,529,189 |
| Freshwater ecotoxicity | kg 1.4-DBC e | 6,752 | 17,299 | 10,630 | 23,752 | 58,434 |
| Marine ecotoxicity | kg 1.4-DBC e | 26,256 | 67,264 | 41,335 | 92,357 | 227,211 |
| Human carcinogenic toxicity | kg 1.4-DBC e | 68,118 | 174,509 | 107,238 | 239,612 | 589,477 |
| Human non-carcinogenic toxicity | kg 1.4-DBC e | 416,639 | 1,067,374 | 655,918 | 1,465,571 | 3,605,502 |
| Land use | m2a crop eq | 34,519 | 88,433 | 54,343 | 121,424 | 298,719 |
| Mineral resources scarcity | kg Cu eq | 5,310 | 13,603 | 8,359 | 18,677 | 45,949 |
| Fossil resource scarcity | kg oil eq | 7,023,758 | 17,993,939 | 11,057,551 | 24,706,787 | 60,782,034 |
| Water consumption | m3 | 34,551 | 88,514 | 54,393 | 121,535 | 298,993 |
| Cumulative energy demand | MJ | 306,000,156 | 783,931,943 | 481,738,191 | 1,076,386,882 | 2,648,057,172 |
7. Conclusions
Disc brakes and pads, as almost all human activities, cause environmental impacts during their life cycle, from raw materials obtention, product manufacturing and product use to end of life.
One of the major concerns related to the product impact is the effects of brake wear generated during product usage. The friction between the brake pad and disc causes abrasion and release particles that contribute to air pollution.
Particle matter emitted from brake wear can contribute up to 21% of total traffic-related PM10 emissions while up to 55% to the total non-exhaust traffic PM10 emissions (emissions not generated by the fuel combustion, but from tyre, brake, clutch and road surface). Moreover, more than 50% of PM10 are particles of less than 2.5 micrometres. The particle size is relevant as coarse particles affect the upper respiratory tract, but finer particles can penetrate into lungs. Because brake wear dust is rich in metals, their presence into the body can cause damage to cells and produce cardiovascular and respiratory diseases and cancer. In fact, in European urban areas brake particulate matter can be responsible for up to 27 days of life lost per person.
We have seen that particle size and chemical characterisation are the aspects that will most influence the potential risk of brake wear dust. However, it needs to be also kept in mind that the temperature of the brakes can cause variations in the dust generated. Thus, at higher temperatures, more ultrafine particles will be generated and it will increase particle concentration.
In rail and air transport non-exhaust particle emissions are also relevant, especially near the trackside and airports.
But brakes do not only have an impact because of wear, but also during its manufacturing, especially because of metals consumption.
During the lifetime of a car, brake elements will need to be replaced, so 12 extra pads will be consumed and 1.5 discs per disc brake. Thus, 19.7kg of brake material will be required per brake, which is equivalent to consuming 1.53 kg of virgin copper.
The carbon footprint of the disc brake used during 240,000 km is 90 kg CO2 eq, which equals the emissions generated during a trip of 508 km in an average passenger car. Moreover, 2,195 MJ of primary non-renewable energy will be consumed per brake.
The impact comes mainly from the raw material required to manufacture discs and pads, cast iron and friction mix.
When analysing global presence of disc brake worldwide, we can see the magnitude of the product where million tons of metal will be consumed to replace brake parts, consuming millions of MWh and emitting millions of tons of greenhouse gases.
8. References
Clas Andersson and Tobias Dettmann (2013) Environmental Footprint and Performance Analysis of a Brake Disc Production Line using Discrete Event Simulation. Master of Science Thesis. CHALMERS UNIVERSITY OF TECHNOLOGY. Gothenburg, Sweden. Available: https://odr.chalmers.se/bitstream/20.500.12380/182182/1/182182.pdf
Collins Aerospace. Aircraft wheels & brakes. Available: https://www.collinsaerospace.com/what-we-do/Commercial-Aviation/Exteriors/Landing-Systems/Aircraft-Wheels-Brakes
DEFRA (2019a) Non-Exhaust Emissions from Road Traffic. Available: https://uk-air.defra.gov.uk/assets/documents/reports/cat09/1907101151_20190709_Non_Exhaust_Emissions_typeset_Final.pdf
DEFRA (2019b) UK Government GHG Conversion Factors for Company Reporting
European Environment Agency (2019) EMEP/EEA air pollutant emission inventory guidebook 2019. Part B: sectorial guidance chapters. 1.A.3.b.vi-vii Road tyre and brake wear 2019. Available: https://www.eea.europa.eu/publications/emep-eea-guidebook-2019/part-b-sectoral-guidance-chapters/1-energy/1-a-combustion/1-a-3-b-vi/view
EUROSTAT (2020) Number of wagons [rail_eq_wagon_n]
Ferm, M., Sjöberg, K. (2015) Concentrations and emission factors for PM2.5 and PM10 from road traffic in Sweden. Atmospheric Environment, 119, 211-219.
Gradin, K.T., Åström, A.H. (2020) Comparative life cycle assessment of car disc brake systems—case study results and method discussion about comparative LCAs. Int J Life Cycle Assess 25, 350–362.
HYDRO SYSTEMS KG (2019) WHAT YOU SHOULD KNOW ABOUT…AIRCRAFT BRAKES. Available: https://www.hydro.aero/en/newsletter-details/what-you-should-know-aboutaircraft-brakes.htm
ICAO (2019) ICAO Aircraft Engine Emissions Databank. Available: https://www.easa.europa.eu/easa-and-you/environment/icao-aircraft-engine-emissions-databank
- Dobney, C. J. Baker, A. D. Quinnaand and L. Chapman (2009) Quantifying the effects of high summer temperatures due to climate change on buckling and rail related delays in south-east United Kingdom. METEOROLOGICAL APPLICATIONS 16: 245 –251. Available: https://rmets.onlinelibrary.wiley.com/doi/epdf/10.1002/met.114
Mattia Alemani (2017) Particle emissions from car brakes: the influence of contact conditions on the pad-to-rotor interface. Doctoral thesis in Machine Design, KTH Industrial Engineering And Management, Stockholm, Sweden. Available: https://www.diva-portal.org/smash/get/diva2:1108806/FULLTEXT01.pdf
Medical Research Council (2020) Air pollution from brake dust may have same harmful effects on immune cells as diesel exhaust. Available: https://mrc.ukri.org/news/browse/air-pollution-from-brake-dust-may-have-same-harmful-effects-on-immune-cells-as-diesel-exhaust/ and https://pubs.rsc.org/en/content/articlelanding/2020/MT/C9MT00253G#!divAbstract
Minh N Nguyen, Xiaoming Wang, and Chi-Hsiang Wang (2012) A reliability assessment of railway track buckling during an extreme heatwave, Proceedings of the Institution of Mechanical Engineers, Part F: Journal of Rail and Rapid Transit, Vol.226, Number 5, September 2012. doi:10.1177/0954409712441743, SAGE publications, UK
Ministerio de Fomento (2017) Observatorio de Costes del Transporte de Mercancías por Carretera. Spanish Government. Available: https://www.fomento.gob.es/CVP/handlers/pdfhandler.ashx?idpub=TTW103
Office of Rail and Road (2019) Rail Infrastructure and Assets 2018-19 Annual Statistical Release. Available: https://dataportal.orr.gov.uk/media/1532/rail-infrastructure-assets-2018-19.pdf
Remigiusz Jasiński, Jacek Pielecha and Jarosław Markowski (2016) Emission of particulate matter during aircraft landing operation. E3S Web of Conferences 10, 00030. Available: https://www.e3s-conferences.org/articles/e3sconf/pdf/2016/05/e3sconf_seed2016_00030.pdf
Spielmann, M., Bauer, C., Dones, R., Tuchschmid, M. (2007) Transport Services. Ecoinvent report No. 14. Swiss Center for Life Cycle Inventories, Dübendorf, 2007
Statista (2020) Number of passenger cars and commercial vehicles in use worldwide from 2006 to 2015 in (1,000 units). Available: https://www.statista.com/statistics/281134/number-of-vehicles-in-use-worldwide/
Statista (2020) Size of aircraft fleets by region worldwide in 2018 and 2038 (in units). Available: https://www.statista.com/statistics/262971/aircraft-fleets-by-region-worldwide/
- Grigoratos and G. Martini (2015) Brake wear particle emissions: a review. Environ. Sci. Pollut. Res., vol. 22, no. 4, pp. 2491–2504.
Texas A&M Transportation Institute. Thermal Buckling: Method for Avoiding Thermal Buckling in Rails. Available: https://groups.tti.tamu.edu/crr/current-research/thermal-buckling/
Tim Hodges (2012) A life-cycle approach to braking costs. International Railway Journal. Available: https://www.railjournal.com/in_depth/a-life-cycle-approach-to-braking-costs
Transport & Environment (2015) Don’t breath here: Tackling air pollution form vehicles. Available: https://www.transportenvironment.org/sites/te/files/publications/Dont_Breathe_Here_report_FINAL.pdf
Annex. Impact categories description
| Environmental impact category | Unit | Description |
|---|---|---|
| Climate change | kg CO2 eq | An increased atmospheric concentration of greenhouse gases will increase the radiative forcing capacity leading to an increase in the global mean temperature (°C). Increased temperature ultimately results in damage to human health and ecosystems. |
| Stratospheric ozone depletion | Kg CFC11 eq | Emissions of Ozone Depleting Substances ultimately lead to damage to human health because of the resultant increase in UVB radiation. Chemicals that deplete ozone are relatively persistent and have chlorine or bromine groups in their molecules that interact with ozone (mainly) in the stratosphere. This increased radiation negatively affects human health, thus increasing the incidence of skin cancer and cataracts. |
| Ionizing radiation | kBq Co-60 eq | Anthropogenic emissions of radionuclides are generated in the nuclear fuel cycle (mining, processing and waste disposal), as well as during other human activities, such as the burning of coal and the extraction of phosphate rock. Exposure to the ionizing radiation caused by these radionuclides can lead to damaged DNA molecules and thus affect human health. |
| Ozone formation, human health | kg NOx eq | Ozone is not directly emitted into the atmosphere, but it is formed as a result of photochemical reactions of NOx and Non Methane Volatile Organic Compounds (NMVOCs). This formation process is more intense in summer. Ozone is a health hazard to humans because it can inflame airways and damage lungs. |
| Fine particulate matter formation | kg PM2.5 eq | Air pollution that causes primary and secondary aerosols in the atmosphere can have a substantial negative impact on human health, affecting the upper part of the airways and lungs when inhaled. |
| Ozone formation, terrestrial ecosystems | kg NOx eq | Ozone is not directly emitted into the atmosphere, but it is formed as a result of photochemical reactions of NOx and Non Methane Volatile Organic Compounds (NMVOCs). Ozone can have a negative impact on vegetation, including a reduction of growth and seed production, an acceleration of leaf senescence and a reduced ability to withstand stressors. |
| Terrestrial acidification | kg SO2 eq | Atmospheric deposition of inorganic substances, such as sulphates, nitrates and phosphates, cause a change in acidity in the soil. This change in acidity can affect the plant species living in the soil, causing them to disappear |
| Freshwater eutrophication | kg P eq | Freshwater eutrophication occurs due to the discharge of nutrients into soil or into freshwater bodies and the subsequent rise in nutrient levels, i.e. phosphorus and nitrogen. Environmental impacts related to freshwater eutrophication are numerous. They follow a sequence of ecological impacts offset by increasing nutrient emissions into fresh water, thereby increasing nutrient uptake by autotrophic organisms such as cyanobacteria and algae, and heterotrophic species such as fish and invertebrates. This ultimately leads to relative loss of species. |
| Terrestrial ecotoxicity | kg 1.4-DBC e | Human toxicity and ecotoxicity accounts for the environmental persistence (fate), accumulation in the human food chain (exposure), and toxicity (effect) of a chemical. This can result in affected species and disease incidences, leading finally to damage to ecosystems and human health. |
| Freshwater ecotoxicity | kg 1.4-DBC e | |
| Marine ecotoxicity | kg 1.4-DBC e | |
| Human carcinogenic toxicity | kg 1.4-DBC e | |
| Human non-carcinogenic toxicity | kg 1.4-DBC e | |
| Land use | m2a crop eq | Land use includes the direct, local impact of land use on terrestrial species via change of land cover and the actual use of the new land. Change of land cover directly affects the original habitat and the original species composition accordingly. |
| Mineral resources scarcity | kg Cu eq | Assessment of consumption of natural resources (distinguished in two indicators depending on whether the resources are energy or non-energy) including a weighting of these resources according to their scarcity and the speed of their exploitation. The more the resource is considered as scarce and exploited, the more the value of the indicator increases and the more the product contributes to the depletion of resources. |
| Fossil resource scarcity | kg oil eq | |
| Water consumption | m3 | Water consumption is the use of water in such a way that the water is evaporated, incorporated into products, transferred to other watersheds or disposed into the sea. Water that has been consumed is thus not available anymore in the watershed of origin for humans nor for ecosystems |
Or explore our technology below by product type.