Ogab® Report – Environmental Impact of Aviation Landing

1. Introduction
Fuel conservation is a significant concern for every airline. During landing and take-off cycle phase (LTO), up to 950m, the specific fuel consumption is significantly higher than it is for cruising. So, any improvement on this stage of the flight will allow substantial fuel saving.
To ensure a good braking effect for the aircraft, several systems and strategies are used to decelerate. Aircraft are equipped with thrust reversers, brake discs and flaps.
In this report, we analyse the environmental and cost repercussions of a new brake disc cooling system. The proposed cooling technology will reduce the rotating disc average temperature and this will have several consequences that will be analysed in this report:
- Brake cooling can be done during the braking period and on the runway prior to a full stop and reaching the terminal.
- Reverse thrust, a high fuel demanding system, is not necessary to stop the aircraft, as excessive brake energy can be avoided and brake can be used more when decelerating.
- Significant amount of time can be saved on the ground as no external cooling is needed, so the period between landing and take-off can be reduced.
- Resources used for the aircraft brake cooling (time and labour) will be eliminated.
The newly developed technology has not been tested yet, so the elimination of reverse thrust may be less than 100%. So in this report, we consider three reverse thrust mitigation scenarios: 100%, 50% and 25%. All the calculations have been made for the 100% reduction scenario and the results are presented in section 2 and 3, while we present the results for the three considerations in section 4.
2. Fuel Saved in Reverse Thrust
A thrust reverser system is designed for the use on ground only. With full reverse thrust, fuel flow can reach 3,200kg/h, a value similar to take-off thrust configuration (Trincheiras, 2016). Considering that normally an aircraft stops in 30 seconds, this means that the fuel consumption operating 100% in reverse thrust can be of 26.67 kg of fuel per aircraft and landing.
This value is very similar to those obtained by Unique for the case of Zurich Airport (Unique, 2005). They evaluated 10 different aircraft landing in Zurich Airport. The duration from touchdown to end of roll out was between 44.2 seconds and 49.5 seconds, while the duration of thrust reverser deployment during roll out was between 28.4 seconds and 34.7 seconds. The fuel consumed by thrust reversers by aircraft was between 12.7 kg and 40.5 kg.
The average price of a barrel of jet fuel in 2018 was $86 per barrel (IATA, 2019), which is 0.67 $/kg. However, the price of jet fuel fluctuates significantly. For example, the average 2020 price is $46.3 per barrel, 0.36 $/kg (IATA, 2020a). Because the 2020 reflects the COVID-19 situation, we are using the average value of 2018 to make calculations in this report. So, the cost on fuel used in reverse thrust per aircraft when landing is $17.94 (£13.81).
The newly developed cooling technology may avoid the need of using reverse thrust, which means that each aircraft may save 26.67 kg of fuel per landing. This saving supposes also a saving on the cost, £13.81 per landing, and on environmental impacts.
In the following table, the environmental savings of avoiding 26.67 kg of jet fuel are presented.
Table 1 Environmental impacts saved per aircraft and landing by avoiding reverse thrust.
| Environmental impact category | Units per aircraft and landing | Environmental impact avoided from fuel saving |
|---|---|---|
| Climate change | kg CO2 eq | 98.42 |
| Stratospheric ozone depletion | Kg CFC11 eq | 3.28E-05 |
| Ionizing radiation | kBq Co-60 eq | 0.74 |
| Ozone formation, human health | kg NOx eq | 0.43 |
| Fine particulate matter formation | kg PM2.5 eq | 9.08E-02 |
| Ozone formation, terrestrial ecosystems | kg NOx eq | 4.35E-01 |
| Terrestrial acidification | kg SO2 eq | 2.83E-01 |
| Freshwater eutrophication | kg P eq | 2.37E-04 |
| Terrestrial ecotoxicity | kg 1.4-DBC e | 79.17 |
| Freshwater ecotoxicity | kg 1.4-DBC e | 3.16E-02 |
| Marine ecotoxicity | kg 1.4-DBC e | 0.12 |
| Human carcinogenic toxicity | kg 1.4-DBC e | 0.32 |
| Human non-carcinogenic toxicity | kg 1.4-DBC e | 1.95 |
| Land use | m2a crop eq | 0.16 |
| Mineral resources scarcity | kg Cu eq | 2.48E-02 |
| Fossil resource scarcity | kg oil eq | 32.84 |
| Water consumption | m3 | 0.16 |
| Cumulative energy demand | MJ | 1,431 |
3. External Brake Cooling System Resources and Time Saving
Currently, once the aircraft has landed, it cannot initiate another flight immediately. Some ground operations are required, one of them being the brake cooling.
In the brakes, the kinetic energy is converted into heat and even after the stop is completed, the temperature continues to rise. In the following graph, the cooling curve of brake is shown by time, comparing the cooling process without intervention and the cooling process using the Brake Cooling System Type BCS 315 from the manufacturer LTG (LTG Incorporated, 2016), and the target temperature that will allow the aircraft to fly again.
Figure 1 Temperature Simulation based on the measured Decay Factors of the Brake Cooling System Type BCS 315. Source: LTG Incorporated, 2016
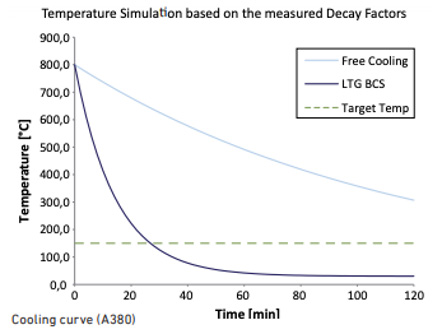
The newly developed cooling technology will require only 5 minutes to get the target safety temperature, while brakes now in require at least 30 minutes to cool using portable cooling fans, and one person per brake.
So, reducing the cooling period once landed, represents:
- a saving on time of 25 minutes, that can be used to initiate another flight and that could be translated also into parking costs savings, and
- 25 minutes of work labour per brake saved.
3.1 Parking Costs Saving
Airlines have to face airport charges for the use of the infrastructure and services. Several European conditions of use including airport charges have been analysed in order to determine the cost saving that could come from the 25 minutes saving. As some charges depend on the MTOW (maximum take-off weight), an average weight has been considered of 172 tonnes per aircraft (average of six different aircraft).
Table 2 Parking charges in different European airports.
| Airport | Condition | Average parking cost per minute and aircraft (£) |
|---|---|---|
| Heathrow, UK | Wide Bodied Aircraft: There is no charge for the first 90 minutes. Charge per 15 minutes or part thereof after the free period is: £61.13 Narrow Bodied Aircraft: There is no charge for the first 30 minutes. Charge per 15 minutes or part thereof after the free period is: £25.47 | 4.08 |
| Luton, UK | Charge per tonne, per minute based on aircraft MTOW: First 15 minutes from time of landing, free of charge After free period £0.037/minute/tonne | 6.36 |
| Madrid, Spain | 0.136884 € per quarter hour or part thereof and tonne (aircraft MTOW) | 1.41 |
| Girona, Spain | 0.071892 € per quarter hour or part thereof and tonne (aircraft MTOW) | 0.74 |
| Paris Vatry, France | Traffic area: 0.20 € per hour and tonne (MTOW) Distant area: 0.10 € per hour and tonne (MTOW) The duration of parking is deducted for every aircraft between the time of landing and take-off time | 0.39 |
Based on these data, we have obtained an average parking cost, without considering the free of charge period after landing: £2.60/minute.
With the proposed new cooling technology, 25 minutes may be saved, which means a saving on parking costs of £64.91 per aircraft and landing.
3.2 Work Labour Cost Saving
Considering a passenger aircraft of eight wheels, it is assumed that four workers spend 30 minutes each of them to cool the braking system. So, with the newly developed technology, it may save 25 minutes per worker.
Ground handling companies worldwide employ 135,000 people (IATA, 2020b). Each year 20,000 new employees are incorporate to these companies and this leads to a cost of $200 million USD, including training costs ($50 million USD).
In order to calculate the labour cost, the UK minimum wage is considered, £8.72 per hour.
The cost work labour to cool the braking system of an aircraft during 30 minutes is £4.36 per employee, so reducing the cooling time 25 minutes causes a saving of £14.53 per aircraft and landing, considering 4 workers.
4. Different Reverse Thrust Consideration
Even though the initial study shows that the reverse thrust could be reduced by 100%, in this section, two conservative scenarios are considered:
- The newly developed technology implies a thrust mitigation of 50%
- The newly developed technology implies a thrust mitigation of 25%
Even if the reverse thrust is reduced by 50% or 25%, the labour and parking cost saving is the same as 100% reduction scenario. So it would reduce only fuel and the related environmental impact.
| Consequences of reverse thrust reduction | Units per aircraft and landing | 100% reverse thrust reduction | 50% reverse thrust reduction | 25% reverse thrust reduction |
|---|---|---|---|---|
| Fuel saving | kg | 26.67 | 13.33 | 6.67 |
| £ | 13.81 | 6.91 | 3.45 | |
| Climate change – carbon emissions saving | kg CO2 eq | 98.42 | 49.21 | 24.61 |
| Parking costs saving | £ | 64.91 | 64.91 | 64.91 |
| Work labour cost saving | £ | 14.53 | 14.53 | 14.53 |
Table 3 Carbon emissions, fuel and costs savings by avoiding reverse thrust 100%, 50% and 25%, per aircraft and landing.
In 2019, 38.9 million flights were performed by the global airline industry (Statista, 2020). So in the following table the annual potential savings of reverse thrust reduction are presented, for the three scenarios considered.
Table 4 Carbon emissions, fuel and costs savings by avoiding reverse thrust 100%, 50% and 25%, per year.
| Consequences of reverse thrust reduction | Units per annual air movements worldwide | 100% reverse thrust reduction | 50% reverse thrust reduction | 25% reverse thrust reduction |
|---|---|---|---|---|
| Fuel saving | tonnes | 1,037,333 | 518,667 | 259,333 |
| £ | 537,389,315 | 268,694,658 | 134,347,329 | |
| Climate change – carbon emissions saving | tonnes CO2 eq | 3,828,634 | 1,914,317 | 957,159 |
| Parking costs saving | £ | 2,524,944,421 | 2,524,944,421 | 2,524,944,421 |
| Work labour cost saving | £ | 565,346,667 | 565,346,667 | 565,346,667 |
5. Conclusions
The newly developed brake cooling technology avoids the need of reverse thrust when stopping the aircraft. As the technology has not been tested yet, different mitigation considerations have been made, 100%, 50% and 25% reverse thrust reduction.
Reducing reverse thrust has several consequences, like reducing fuel consumption when landing, which means a reduction in costs and carbon emissions and other environmental impacts, and reducing the need of external cooling once landed, which is translated into labour work and parking cost savings.
For landing, an aircraft can save between 6.67 and 26.67 kg of jet fuel if reverse thrust is 25% or completely avoided. It implies a reduction in costs of at least £3.45 and maximum £13.81. In terms of carbon emissions, the 98.42 kg CO2 eq would not be emitted.
As the cooling process saves time on external brake cooling, £64.91 can be saved on parking costs and £14.53 on labour costs.
If we consider that 100% reverse thrust is eliminated on each landing, an aircraft can save £93.26, £86.35 if it is reduced 50% and £82.90 if reduced 25%.
On global annual terms, based on the number of flights of year 2019, reducing 100% reverse thrust means saving £3,628 million. If it is reduced by 50%, the saving would be £3,359 million and £3,225 million if reduced by 25%.
6. References
AENA (2019) Price Guide. Available at: http://www.aena.es/csee/ccurl/480/32/Aena-price-guide-2019-ed7.pdf
Aéroport de Vatry (2018) Airport fees and charges 2018. Available at: http://www.pro.vatry.com/cargo_wpress/wp-content/uploads/2018/11/TARIFS-EPIC-2018-v2-ENG.pdf
Heathrow Airport Limited (2019) Conditions of Use including Airport Charges from 1 January 2020. Available at: https://www.heathrow.com/content/dam/heathrow/web/common/documents/company/doing-business-with-heathrow/flights-condition-of-use/conditions-of-use-documents/Heathrow_Conditions_of_Use_2020.pdf
IATA (2019) Airline Maintenance Cost Executive Commentary. Edition 2019. International Air Transport Association. Maintenance Cost Technical Group. Available at: https://www.iata.org/contentassets/bf8ca67c8bcd4358b3d004b0d6d0916f/mctg-fy2018-report-public.pdf
IATA (2020a) Jet Fuel Price Monitor. International Air Transport Association. Available at: https://www.iata.org/en/publications/economics/fuel-monitor/
IATA (2020b) Ground Operations. Available at: https://youtu.be/TVNacrOjJwM
London Luton Airport (2019) Charges & Conditions of Use 2019/20. Available at: https://www.london-luton.co.uk/LondonLuton/files/fe/fe73134b-f3ec-4bd4-bf1f-e9e18d2b65cf.pdf
LTG Incorporated (2016) Brake Cooling System Type BCS 315. Available at: https://www.ltg.de/app/uploads/2016/02/BCS_Brake-Cooling-System_US.pdf
OECD (2020) OECD Data. Hours worked 2019. Available at: https://data.oecd.org/emp/hours-worked.htm
Statista (2020) Number of flights performed by the global airline industry from 2004 to 2021 (in millions). Available at: https://www.statista.com/statistics/564769/airline-industry-number-of-flights/
Trincheiras, Simao (2016) Fuel Conservation Strategies Through Flight Operation Optimization at PGA. Master Thesis. Instituto Superior Tecnico, Lisboa, Portugal
Unique (2005). Engine Thrust Reverser Emissions at Zurich Airport. Unique (Flughafen Zürich AG)
Annex. Impact categories description
| Environmental impact category | Unit | Description |
|---|---|---|
| Climate change | kg CO2 eq | An increased atmospheric concentration of greenhouse gases will increase the radiative forcing capacity leading to an increase in the global mean temperature (°C). Increased temperature ultimately results in damage to human health and ecosystems. |
| Stratospheric ozone depletion | Kg CFC11 eq | Emissions of Ozone Depleting Substances ultimately lead to damage to human health because of the resultant increase in UVB radiation. Chemicals that deplete ozone are relatively persistent and have chlorine or bromine groups in their molecules that interact with ozone (mainly) in the stratosphere. This increased radiation negatively affects human health, thus increasing the incidence of skin cancer and cataracts. |
| Ionizing radiation | kBq Co-60 eq | Anthropogenic emissions of radionuclides are generated in the nuclear fuel cycle (mining, processing and waste disposal), as well as during other human activities, such as the burning of coal and the extraction of phosphate rock. Exposure to the ionizing radiation caused by these radionuclides can lead to damaged DNA molecules and thus affect human health. |
| Ozone formation, human health | kg NOx eq | Ozone is not directly emitted into the atmosphere, but it is formed as a result of photochemical reactions of NOx and Non Methane Volatile Organic Compounds (NMVOCs). This formation process is more intense in summer. Ozone is a health hazard to humans because it can inflame airways and damage lungs. |
| Fine particulate matter formation | kg PM2.5 eq | Air pollution that causes primary and secondary aerosols in the atmosphere can have a substantial negative impact on human health, affecting the upper part of the airways and lungs when inhaled. |
| Ozone formation, terrestrial ecosystems | kg NOx eq | Ozone is not directly emitted into the atmosphere, but it is formed as a result of photochemical reactions of NOx and Non Methane Volatile Organic Compounds (NMVOCs). Ozone can have a negative impact on vegetation, including a reduction of growth and seed production, an acceleration of leaf senescence and a reduced ability to withstand stressors. |
| Terrestrial acidification | kg SO2 eq | Atmospheric deposition of inorganic substances, such as sulphates, nitrates and phosphates, cause a change in acidity in the soil. This change in acidity can affect the plant species living in the soil, causing them to disappear |
| Freshwater eutrophication | kg P eq | Freshwater eutrophication occurs due to the discharge of nutrients into soil or into freshwater bodies and the subsequent rise in nutrient levels, i.e. phosphorus and nitrogen. Environmental impacts related to freshwater eutrophication are numerous. They follow a sequence of ecological impacts offset by increasing nutrient emissions into fresh water, thereby increasing nutrient uptake by autotrophic organisms such as cyanobacteria and algae, and heterotrophic species such as fish and invertebrates. This ultimately leads to relative loss of species. |
| Terrestrial ecotoxicity | kg 1.4-DBC e | Human toxicity and ecotoxicity accounts for the environmental persistence (fate), accumulation in the human food chain (exposure), and toxicity (effect) of a chemical. This can result in affected species and disease incidences, leading finally to damage to ecosystems and human health. |
| Freshwater ecotoxicity | kg 1.4-DBC e | |
| Marine ecotoxicity | kg 1.4-DBC e | |
| Human carcinogenic toxicity | kg 1.4-DBC e | |
| Human non-carcinogenic toxicity | kg 1.4-DBC e | |
| Land use | m2a crop eq | Land use includes the direct, local impact of land use on terrestrial species via change of land cover and the actual use of the new land. Change of land cover directly affects the original habitat and the original species composition accordingly. |
| Mineral resources scarcity | kg Cu eq | Assessment of consumption of natural resources (distinguished in two indicators depending on whether the resources are energy or non-energy) including a weighting of these resources according to their scarcity and the speed of their exploitation. The more the resource is considered as scarce and exploited, the more the value of the indicator increases and the more the product contributes to the depletion of resources. |
| Fossil resource scarcity | kg oil eq | |
| Water consumption | m3 | Water consumption is the use of water in such a way that the water is evaporated, incorporated into products, transferred to other watersheds or disposed into the sea. Water that has been consumed is thus not available anymore in the watershed of origin for humans nor for ecosystems |
| Cumulative energy demand | MJ | The Cumulative Energy Demand represents the direct and indirect energy use throughout the life cycle, including the energy consumed during the extraction, manufacturing and disposal of the raw and auxiliary materials. |
Or explore our technology below by product type.