Ogab® Report – Impact of Reduced Fuel Consumption on Road Vehicles

Road transport fuel consumption
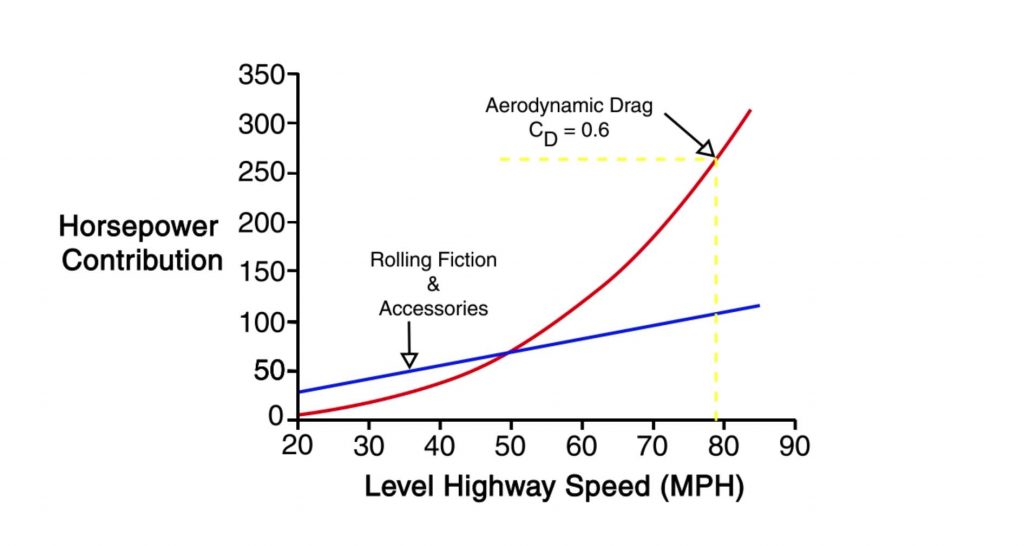
Fuel is consumed by a vehicle’s engine as it travels on the road, with engine power output contributing to five primary factors: Drivetrain, Inertia/braking/grade, Rolling resistance, Auxiliary loads and Aerodynamics losses.
In an urban environment, the power dissipated through acceleration and braking of the vehicle is the dominant loss, whereas on the highway, the aerodynamic losses are dominant.
In this section, the fuel consumption and its impact on various vehicles is analysed. In the next table, the assumed fuel consumption is presented per type of vehicle.

Table 1 Fuel consumption per year and vehicle lifespan of various road vehicles. Source: Ministerio de Fomento, 2017
| Type of vehicle | Yearly km considered | Vehicle lifespan (total km) | Average vehicle fuel consumption (litres/100 km) | Annual fuel consumption (litres) | Vehicle lifespan fuel consumption (litres) |
|---|---|---|---|---|---|
| Lorry. Articulated lorry | 120,000 | 1,200,000 | 38.5 | 46,200 | 462,000 |
| Lorry. 3 axle truck | 95,000 | 950,000 | 30 | 28,500 | 285,000 |
| Lorry. 3 axle truck | 90,000 | 900,000 | 26 | 23,400 | 234,000 |
| Average lorry | 101,667 | 1,016,667 | 31.5 | 32,025 | 320,250 |
| Van | 50,000 | 400,000 | 12 | 6,000 | 48,000 |
| Car | – | 240,000 | 7 | – | 16,800 |
The related environmental impacts of current average fuel consumption per vehicle are presented below.
Table 2 Environmental impacts of fuel consumption (fuel production and combustion) during each vehicle lifespan.
| Environmental impact category | Units | One vehicle lifespan | ||
|---|---|---|---|---|
| Average lorry | Van | Car | ||
| Climate change | kg CO2 eq | 982,882 | 145,467 | 49,874 |
| Stratospheric ozone depletion | Kg CFC11 eq | 0.53 | 0.09 | 0.02 |
| Ionizing radiation | kBq Co-60 eq | 7,279 | 1,062 | 366 |
| Ozone formation, human health | kg NOx eq | 4,665 | 683 | 91 |
| Fine particulate matter formation | kg PM2.5 eq | 914 | 183 | 33 |
| Ozone formation, terrestrial ecosystems | kg NOx eq | 4,709 | 701 | 94 |
| Terrestrial acidification | kg SO2 eq | 2,698 | 405 | 89 |
| Freshwater eutrophication | kg P eq | 1.05 | 0.17 | 0.07 |
| Terrestrial ecotoxicity | kg 1.4-DBC e | 228,091 | 512,409 | 38,666 |
| Freshwater ecotoxicity | kg 1.4-DBC e | 292 | 73 | 15 |
| Marine ecotoxicity | kg 1.4-DBC e | 579 | 330 | 41 |
| Human carcinogenic toxicity | kg 1.4-DBC e | 740 | 919 | 36 |
| Human non-carcinogenic toxicity | kg 1.4-DBC e | 39,415 | 4,979 | 1,977 |
| Land use | m2a crop eq | 499 | 58 | 33 |
| Mineral resources scarcity | kg Cu eq | 7.0 | 2.6 | 1.9 |
| Fossil resource scarcity | kg oil eq | 327,199 | 48,507 | 16,485 |
| Water consumption | m3 | 1,438 | 211 | 75 |
| Cumulative energy demand | MJ | 14,195,199 | 2,100,882 | 716,678 |
For the worldwide vehicle fleet, 947 million cars, 279 million vans and 56 million lorries, the results for the carbon footprint and energy demand are shown.
Table 3 Carbon footprint and energy demand during worldwide vehicles lifespan.
| Impact category | Units per type of vehicle worldwide | Lorries | Vans | Cars |
|---|---|---|---|---|
| Climate change | tons CO2eq | 54,632,799,006 | 40,673,327,063 | 47,234,240,002 |
| Cumulative energy demand | MWh | 219,174,945,635 | 163,171,808,963 | 188,542,095,383 |
Aerodynamic drag reduction benefits
With the proposed vehicle aerodynamic drag reduction solution, Advanced TRS®, with 40.98% improvement on drag coefficient, it is possible to reduce fuel consumption by 20.49%. So:
- 65,619 litres of diesel can be saved during a lorry service life
- 9,835 litres of fuel can be saved during a van lifespan
- 3,442 litres of fuel can be saved during a car service life
This potential fuel consumption reduction can be translated into emissions savings. In the following table, the potential savings are presented:

Table 4 Environmental impacts saved due to 20.49% fuel reduction during each vehicle lifespan.
| Environmental impact category | Units | One vehicle lifespan savings due to 20.49% fuel reduction | ||
|---|---|---|---|---|
| Average lorry | Van | Car | ||
| Climate change | kg CO2 eq | 201,393 | 29,806 | 10,219 |
| Stratospheric ozone depletion | Kg CFC11 eq | 0.11 | 0.018 | 0.005 |
| Ionizing radiation | kBq Co-60 eq | 1,492 | 218 | 75 |
| Ozone formation, human health | kg NOx eq | 956 | 140 | 19 |
| Fine particulate matter formation | kg PM2.5 eq | 187 | 38 | 7 |
| Ozone formation, terrestrial ecosystems | kg NOx eq | 965 | 144 | 19 |
| Terrestrial acidification | kg SO2 eq | 553 | 83 | 18 |
| Freshwater eutrophication | kg P eq | 0.21 | 0.036 | 0.015 |
| Terrestrial ecotoxicity | kg 1.4-DBC e | 46,736 | 104,993 | 7,923 |
| Freshwater ecotoxicity | kg 1.4-DBC e | 60 | 15 | 3 |
| Marine ecotoxicity | kg 1.4-DBC e | 119 | 68 | 8 |
| Human carcinogenic toxicity | kg 1.4-DBC e | 152 | 188 | 7 |
| Human non-carcinogenic toxicity | kg 1.4-DBC e | 8,076 | 1,020 | 405 |
| Land use | m2a crop eq | 102 | 12 | 7 |
| Mineral resources scarcity | kg Cu eq | 1.4 | 0.5 | 0.4 |
| Fossil resource scarcity | kg oil eq | 67,043 | 9,939 | 3,378 |
| Water consumption | m3 | 295 | 43 | 15 |
| Cumulative energy demand | MJ | 2,908,596 | 430,471 | 146,847 |
Worldwide, this 20.49% fuel reduction can be translated to show reduced greenhouse gas emissions and energy used:
Table 5 Avoided impact due to 20.49% fuel reduction worldwide
| Impact category | Units per type of vehicle worldwide | Lorries | Vans | Cars |
|---|---|---|---|---|
| Climate change | Avoided tons CO2eq | 11,194,260,516 | 8,333,964,715 | 9,678,295,777 |
| Cumulative energy demand | Avoided MWh | 44,908,946,361 | 33,433,903,656 | 38,632,275,344 |
References
Ministerio de Fomento (2017) Observatorio de Costes del Transporte de Mercancías por Carretera. Spanish Government.
Available: https://www.fomento.gob.es/CVP/handlers/pdfhandler.ashx?idpub=TTW103
Spielmann, M., Bauer, C., Dones, R., Tuchschmid, M. (2007) Transport Services. Ecoinvent report No. 14. Swiss Center for Life Cycle Inventories, Dübendorf, 2007
Annex. Impact categories description
| Environmental impact category | Unit | Description |
|---|---|---|
| Climate change | kg CO2 eq | An increased atmospheric concentration of greenhouse gases will increase the radiative forcing capacity leading to an increase in the global mean temperature (°C). Increased temperature ultimately results in damage to human health and ecosystems. |
| Stratospheric ozone depletion | Kg CFC11 eq | Emissions of Ozone Depleting Substances ultimately lead to damage to human health because of the resultant increase in UVB radiation. Chemicals that deplete ozone are relatively persistent and have chlorine or bromine groups in their molecules that interact with ozone (mainly) in the stratosphere. This increased radiation negatively affects human health, thus increasing the incidence of skin cancer and cataracts. |
| Ionizing radiation | kBq Co-60 eq | Anthropogenic emissions of radionuclides are generated in the nuclear fuel cycle (mining, processing and waste disposal), as well as during other human activities, such as the burning of coal and the extraction of phosphate rock. Exposure to the ionizing radiation caused by these radionuclides can lead to damaged DNA molecules and thus affect human health. |
| Ozone formation, human health | kg NOx eq | Ozone is not directly emitted into the atmosphere, but it is formed as a result of photochemical reactions of NOx and Non Methane Volatile Organic Compounds (NMVOCs). This formation process is more intense in summer. Ozone is a health hazard to humans because it can inflame airways and damage lungs. |
| Fine particulate matter formation | kg PM2.5 eq | Air pollution that causes primary and secondary aerosols in the atmosphere can have a substantial negative impact on human health, affecting the upper part of the airways and lungs when inhaled. |
| Ozone formation, terrestrial ecosystems | kg NOx eq | Ozone is not directly emitted into the atmosphere, but it is formed as a result of photochemical reactions of NOx and Non Methane Volatile Organic Compounds (NMVOCs). Ozone can have a negative impact on vegetation, including a reduction of growth and seed production, an acceleration of leaf senescence and a reduced ability to withstand stressors. |
| Terrestrial acidification | kg SO2 eq | Atmospheric deposition of inorganic substances, such as sulphates, nitrates and phosphates, cause a change in acidity in the soil. This change in acidity can affect the plant species living in the soil, causing them to disappear |
| Freshwater eutrophication | kg P eq | Freshwater eutrophication occurs due to the discharge of nutrients into soil or into freshwater bodies and the subsequent rise in nutrient levels, i.e. phosphorus and nitrogen. Environmental impacts related to freshwater eutrophication are numerous. They follow a sequence of ecological impacts offset by increasing nutrient emissions into fresh water, thereby increasing nutrient uptake by autotrophic organisms such as cyanobacteria and algae, and heterotrophic species such as fish and invertebrates. This ultimately leads to relative loss of species. |
| Terrestrial ecotoxicity | kg 1.4-DBC e | Human toxicity and ecotoxicity accounts for the environmental persistence (fate), accumulation in the human food chain (exposure), and toxicity (effect) of a chemical. This can result in affected species and disease incidences, leading finally to damage to ecosystems and human health. |
| Freshwater ecotoxicity | kg 1.4-DBC e | |
| Marine ecotoxicity | kg 1.4-DBC e | |
| Human carcinogenic toxicity | kg 1.4-DBC e | |
| Human non-carcinogenic toxicity | kg 1.4-DBC e | |
| Land use | m2a crop eq | Land use includes the direct, local impact of land use on terrestrial species via change of land cover and the actual use of the new land. Change of land cover directly affects the original habitat and the original species composition accordingly. |
| Mineral resources scarcity | kg Cu eq | Assessment of consumption of natural resources (distinguished in two indicators depending on whether the resources are energy or non-energy) including a weighting of these resources according to their scarcity and the speed of their exploitation. The more the resource is considered as scarce and exploited, the more the value of the indicator increases and the more the product contributes to the depletion of resources. |
| Fossil resource scarcity | kg oil eq | |
| Water consumption | m3 | Water consumption is the use of water in such a way that the water is evaporated, incorporated into products, transferred to other watersheds or disposed into the sea. Water that has been consumed is thus not available anymore in the watershed of origin for humans nor for ecosystems |
Or explore our technology below by product type.